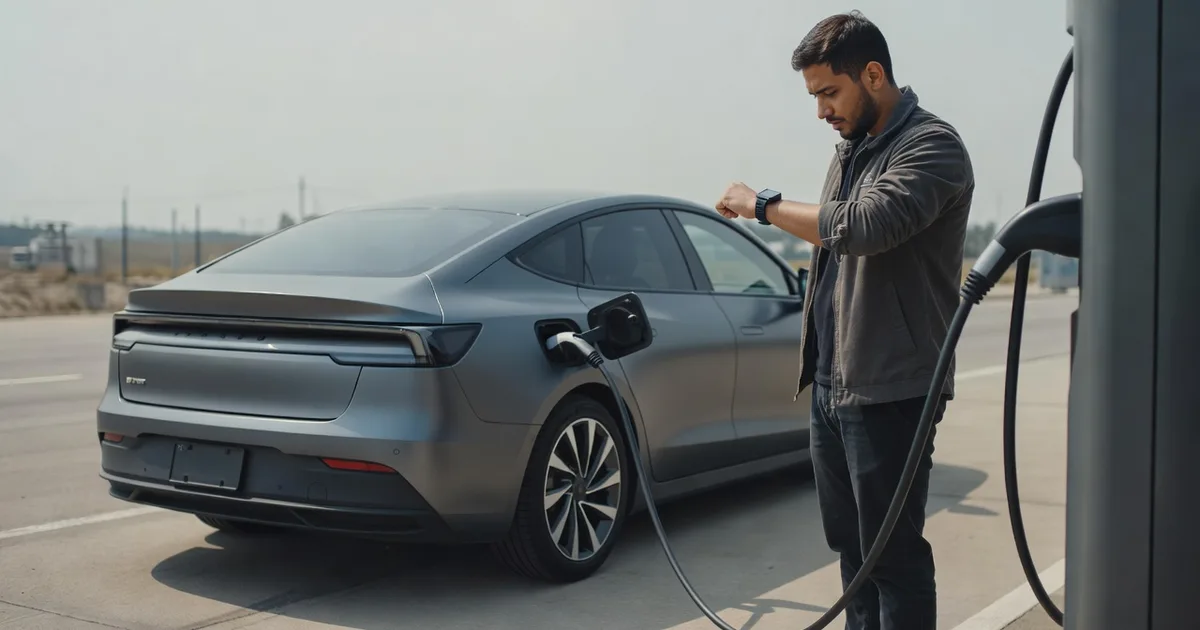
The Tesla Model 3 peaks at 250 kW. The Hyundai Ioniq 6 peaks at 233 kW. The Ioniq 6 completes a 10–80 per cent charge in seventeen minutes and the Model 3 needs twenty-eight. The car with the lower headline number leaves eleven minutes earlier, and that is not an anomaly — it is what happens when you buy on peak power.
Peak power is a moment, not a rate
A charging session is not a constant. Plug in at 10 per cent state of charge and the car ramps up over a minute or two, holds its highest power briefly, then tapers — gently at first, steeply after about 60 per cent, and to a crawl past 90.
The advertised peak is the top of that curve. It might be held for two minutes of a thirty-minute stop. What you actually experience is the area under the curve, and two cars with the same peak can enclose very different areas.
This is why every charging figure on this site is a 10–80 per cent time, and why our charging ranking is ordered on that window rather than on peak kW. It reorders the field substantially.
Four cars, and what the numbers hide
| Car | Peak DC | 10–80% | Architecture |
|---|---|---|---|
| Kia EV6 84 kWh RWD | 263 kW | 17 min | 800 V |
| Hyundai Ioniq 6 Long Range RWD | 233 kW | 17 min | 800 V |
| Tesla Model 3 Long Range AWD | 250 kW | 28 min | 400 V |
| Nissan Ariya e-4ORCE 87 kWh | 130 kW | 48 min | 400 V |
The Ariya is the clearest case in our database of why capacity does not rescue a slow charging curve. It carries 87 kWh usable — one of the largest packs here — and needs forty-eight minutes for the same percentage window the EV6 does in seventeen. On a long drive that difference compounds, because the Ariya also has less real range to start with.
Why 800 volts wins the window
Power is voltage times current. To draw 250 kW at 400 volts a car needs roughly 625 amps; at 800 volts it needs roughly 313. Resistive heating rises with the square of current, so halving the current cuts the heat generated in the cables, contactors and cells to about a quarter.
Heat is what makes a battery management system reduce charging power. Less heat means it can hold high power across a wider state-of-charge window before backing off. The advantage is not a taller peak — it is a flatter curve. Our 800-volt list shows which cars run the architecture.
Why 10 to 80, and not 0 to 100
Because almost nobody charges to 100 per cent on a journey. The last twenty per cent is by far the slowest part of the curve — on many cars it takes as long as the first sixty — so including it would mostly measure time nobody spends. Charging to 100 makes sense overnight at home on AC, where the speed is irrelevant.
The bottom ten per cent is excluded for the mirror-image reason: you rarely arrive at a charger that empty, and cars behave oddly at very low state of charge.
One caveat about the window that matters more than the rest of this article. A percentage is not a distance. Charging 10–80 per cent of a 96 kWh pack recovers far more range than the same window on a 65 kWh pack, even if the small car does it faster. Read a charge time next to the car’s observed range, never on its own.
What the published figures still will not tell you
Cold. Every figure on this site is from testing in reasonable conditions with a battery at a sensible temperature. A cold pack that has not been pre-conditioned can take twice as long, and no published number captures that. Cars that pre-condition automatically when you navigate to a charger have a real advantage here that appears in no specification.
The charger. A 263 kW car on a 50 kW post is a 50 kW car. Network coverage, reliability and queueing decide more real journeys than any figure in our database, and none of it is something this site can measure.
Sharing. Many charging cabinets split power between two bays. Arrive alongside another car and your 150 kW can become 75 kW with no warning and no fault.
The practical rule
If you rapid charge rarely, none of this should decide your purchase — the pack voltage is a specification you will meet a handful of times a year. If you drive long distances regularly, the 10–80 time is one of the few numbers on a spec sheet that genuinely changes your day, and the peak kW figure is close to noise.
The practical consequence is measured in how many charging stops a 500-mile drive takes: the number of stops is the same for every car here, but the time they cost ranges from 34 minutes to 96.
Frequently asked questions
Does a high peak kW ever actually help?
Yes — for a short top-up. If you are adding twenty per cent rather than seventy, a high early peak is exactly what you want, because you never reach the taper. It is the full window where sustained power matters more than the spike.
Will fast charging wear out my battery?
Published fleet data suggests heavy reliance on high-power DC charging is associated with faster capacity loss — cars doing more than about an eighth of their sessions on DC above 100 kW degraded noticeably faster than cars charged mainly on AC. Occasional rapid charging on a journey is not the problem; making it your only charging method is.
Why does my car charge slower than the figure here?
Most likely the battery temperature, the charger’s actual output, or power sharing with the bay next to you. Published figures assume a pre-conditioned pack and a charger that can deliver the car’s peak — conditions that hold less often than you would like.
Is AC charging speed worth checking too?
If you have three-phase supply where you park, very much so. Most cars accept 11 kW; the Nissan Ariya in our database accepts 22 kW, which halves an overnight charge and inverts its poor rapid-charging position for anyone who charges at a destination rather than on a motorway.
Which means most drivers can ignore the fastest chargers
If the peak figure does not decide the wait, the charger’s rating often does not either. Measured across eighteen cars, only five — all of them 800-volt — charge any faster on a 350 kW station than on a 150 kW one; every 400-volt car, the four Teslas included, is already at its own limit by 150 kW, and so is the 800-volt BYD Seal, whose 150 kW peak never asks for more. The table is in do you need a 350 kW charger.
Sources
- Charging figures and their individual sources: the vehicle pages on this site, each credited with the source and the date read.
- Geotab — EV battery degradation across a large commercial fleet, including the effect of DC fast charging
The 10 to 80 window, car by car
Every car here has a page that takes its own 10 to 80 per cent time and turns it into the two things you can act on: how many miles go in per hour at each kind of charger, and what the electricity costs at home against a public station.
- Hyundai Ioniq 6 charging time and cost — 17 min against a 233 kW peak
- Kia EV6 charging time and cost — 17 min against a 263 kW peak
- Hyundai Ioniq 5 charging time and cost — 18 min against a 263 kW peak
- Porsche Taycan charging time and cost — 19 min against a 270 kW peak
- Kia EV9 charging time and cost — 22 min against a 209 kW peak
- Tesla Model Y charging time and cost — 27 min against a 250 kW peak
- Volkswagen ID.7 charging time and cost — 27 min against a 190 kW peak
- BMW i4 charging time and cost — 28 min against a 205 kW peak
- Tesla Model 3 charging time and cost — 28 min against a 250 kW peak
- Toyota bZ4X charging time and cost — 28 min against a 150 kW peak
- Volkswagen ID.4 charging time and cost — 28 min against a 175 kW peak
- Volvo EX30 charging time and cost — 28 min against a 158 kW peak
- Ford Mustang Mach-E charging time and cost — 32 min against a 150 kW peak
- BYD Seal charging time and cost — 36 min against a 150 kW peak
- Nissan Ariya charging time and cost — 48 min against a 130 kW peak