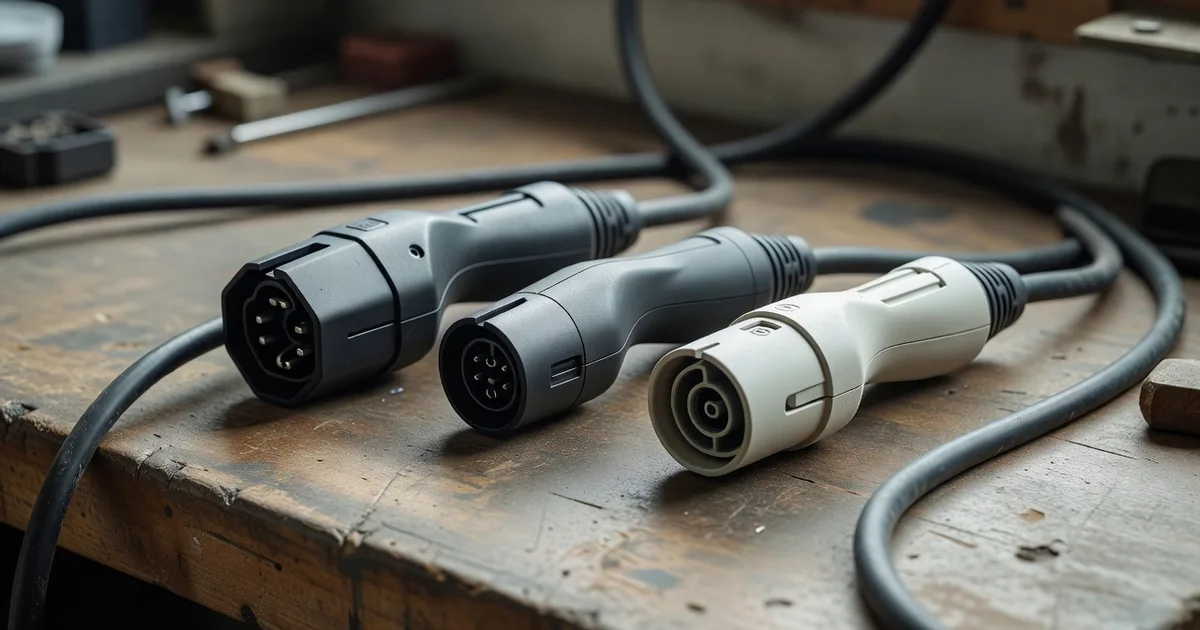
Of the 15,433 public DC fast-charging sites in the federal station locator, 12,401 list a CCS1 plug, 4,873 list the NACS (J3400) connector and 5,533 still list CHAdeMO. Those add to more than the number of sites, because a site is listed once per connector it carries. The plug counts run the other way: Tesla’s network alone holds 38,307 of the country’s 76,041 fast-charging plugs, 50.4 per cent. Department of Energy data, pulled 16 September 2026.
What the counts are counting
This is a table of how sites are filed, not of how many a given car can drive up to and use. Three things follow, and all three matter more than the headline numbers.
- The rows overlap. They sum to 24,230 listings against 15,433 sites, because one site carrying CCS1 and CHAdeMO appears in both. They are not slices of a pie and cannot be turned into one.
- A listed connector is not an open connector. The database records what hardware a site has, not who is allowed to use it, and those two have diverged since Tesla began opening parts of its network to other brands.
- Connector variety is not stall count. 4,978 of the 15,433 sites have a single plug however many standards it covers. If it is occupied, the connector question is academic.
One code needs naming because it is easy to get wrong. The locator’s TESLA value is documented as “NACS (J3400 AC/DC)” — that is the NACS row above. J3271 is a different standard entirely, MCS, the megawatt connector for trucks, and only 2 sites in the country list it. Counting NACS from the J3271 code, as it is tempting to do because the name looks newer, understates it by three orders of magnitude.
Every connector in the federal database
| Connector | Sites listing it | Share of sites | What it is |
|---|---|---|---|
| CCS1 | 12,401 | 80.4% | The combined plug almost every non-Tesla EV sold in the US has used |
| CHAdeMO | 5,533 | 35.9% | The Japanese standard on older 50 kW posts; new installs have moved on |
| NACS (J3400) | 4,873 | 31.6% | Tesla’s connector, standardised as SAE J3400 and adopted across the industry |
| J1772 (AC) | 1,419 | 9.2% | An AC socket listed at a site that also has DC hardware |
| MCS (J3271) | 2 | 0.0% | Megawatt charging for trucks, not a car connector |
CCS1 at 80.4 per cent of sites is the closest thing to a default. The surprise is CHAdeMO: the standard everybody calls dead is listed at 5,533 sites, more than list NACS. Almost none of it is new. CHAdeMO is what older 50 kW posts were built with, they have not been removed, and a count of hardware in the ground lags the market by years in both directions.
A NACS site and a CCS1 site are not the same size
Group the sites by which of the two DC car connectors they carry and the averages separate immediately. This is the part of the plug argument that usually gets lost, and it is the part that decides whether you wait.
| Connectors at the site | Sites | Plugs | Plugs per site | Single-plug sites |
|---|---|---|---|---|
| NACS only | 2,906 | 35,321 | 12.2 | 0.4% |
| Both NACS and CCS1 | 1,967 | 11,449 | 5.8 | 30.7% |
| CCS1 only | 10,434 | 29,105 | 2.8 | 40.8% |
A NACS-only site averages 12.2 plugs and is almost never a single post — 0.4 per cent of them. A CCS1-only site averages 2.8, and 40.8 per cent of them are one plug: one other car, or one fault, and there is nothing else at that exit. That gap is not about the shape of the connector. It is about who built the site and to what plan, and it is the single biggest practical difference behind the two columns. The same arithmetic, across the whole country, is in our count of every public fast charger in the US.
The NACS cable is no longer only Tesla’s
1,763 sites that are not Tesla’s now list a NACS connector, 8,463 plugs between them — 36.2 per cent of every site in the country with that connector. This is the transition made countable rather than announced.
| Network | Sites with NACS listed | All its DC sites | Share |
|---|---|---|---|
| ChargePoint | 683 | 4,363 | 15.7% |
| IONNA | 175 | 175 | 100.0% |
| Walmart | 110 | 110 | 100.0% |
| EVgo | 106 | 1,179 | 9.0% |
| Rivian Adventure Network | 77 | 158 | 48.7% |
| Mercedes-Benz HPC | 74 | 80 | 92.5% |
| Red E | 68 | 576 | 11.8% |
| Applegreen Electric | 49 | 74 | 66.2% |
| 7-Eleven 7Charge | 36 | 46 | 78.3% |
| bp pulse | 36 | 91 | 39.6% |
| EVCS | 34 | 221 | 15.4% |
| Blink | 29 | 643 | 4.5% |
The traffic in the other direction is far smaller. Of Tesla’s 3,110 sites, only 248 — 8.0 per cent — also list a CCS1 connector. Everything else in that network is a NACS cable, reachable by a CCS1 car only through an adapter and only where the operator has opened the site.
Which connector the sites near you carry
Sites rather than plugs, because the locator records connectors at site level. The two connector columns overlap wherever a site carries both. Nationally the NACS share of sites is 31.6 per cent; by state it runs from 51.1 per cent in Nevada down to 14.1 per cent in Iowa (states with at least fifty sites). Long-corridor states where Tesla built early sit high; states whose fast-charging estate grew out of utility and ChargePoint deployments sit low.
| State | DC sites | DC plugs | NACS sites | CCS1 sites | NACS share |
|---|---|---|---|---|---|
| California | 2,690 | 18,572 | 1,045 | 2,016 | 38.8% |
| Florida | 890 | 5,128 | 375 | 637 | 42.1% |
| Texas | 883 | 5,374 | 370 | 685 | 41.9% |
| New York | 759 | 3,415 | 227 | 666 | 29.9% |
| Illinois | 605 | 2,891 | 126 | 530 | 20.8% |
| Michigan | 558 | 1,746 | 104 | 507 | 18.6% |
| Georgia | 539 | 2,281 | 176 | 451 | 32.7% |
| Washington | 529 | 2,315 | 161 | 442 | 30.4% |
| Massachusetts | 527 | 1,971 | 115 | 463 | 21.8% |
| Colorado | 498 | 1,687 | 127 | 454 | 25.5% |
| Ohio | 428 | 1,535 | 91 | 369 | 21.3% |
| Pennsylvania | 425 | 2,020 | 170 | 320 | 40.0% |
| New Jersey | 412 | 2,114 | 144 | 344 | 35.0% |
| Virginia | 369 | 1,826 | 123 | 253 | 33.3% |
| North Carolina | 362 | 1,888 | 118 | 265 | 32.6% |
| Maryland | 356 | 1,527 | 88 | 282 | 24.7% |
| Oregon | 337 | 1,319 | 82 | 276 | 24.3% |
| Minnesota | 251 | 914 | 63 | 213 | 25.1% |
| Tennessee | 247 | 1,024 | 85 | 200 | 34.4% |
| Wisconsin | 239 | 910 | 75 | 202 | 31.4% |
| Alabama | 238 | 891 | 74 | 205 | 31.1% |
| Missouri | 224 | 893 | 56 | 186 | 25.0% |
| Arizona | 215 | 1,504 | 84 | 155 | 39.1% |
| Indiana | 213 | 1,012 | 59 | 162 | 27.7% |
| South Carolina | 203 | 938 | 56 | 158 | 27.6% |
| Utah | 194 | 1,009 | 69 | 150 | 35.6% |
| Connecticut | 193 | 761 | 53 | 154 | 27.5% |
| Oklahoma | 189 | 897 | 34 | 173 | 18.0% |
| New Mexico | 177 | 611 | 31 | 153 | 17.5% |
| Iowa | 149 | 577 | 21 | 130 | 14.1% |
| Nevada | 141 | 1,174 | 72 | 79 | 51.1% |
| Maine | 136 | 435 | 44 | 113 | 32.4% |
| Kentucky | 114 | 460 | 45 | 95 | 39.5% |
| Vermont | 106 | 319 | 15 | 97 | 14.2% |
| Mississippi | 99 | 345 | 25 | 87 | 25.3% |
| Louisiana | 94 | 410 | 23 | 76 | 24.5% |
| Nebraska | 93 | 282 | 16 | 84 | 17.2% |
| Idaho | 86 | 309 | 23 | 69 | 26.7% |
| Kansas | 86 | 382 | 25 | 68 | 29.1% |
| New Hampshire | 81 | 346 | 25 | 61 | 30.9% |
| Arkansas | 65 | 287 | 21 | 55 | 32.3% |
| Delaware | 56 | 311 | 22 | 35 | 39.3% |
| West Virginia | 56 | 217 | 20 | 38 | 35.7% |
| Montana | 55 | 258 | 23 | 34 | 41.8% |
| Rhode Island | 48 | 146 | 9 | 42 | 18.8% |
| Hawaii | 47 | 179 | 14 | 37 | 29.8% |
| South Dakota | 46 | 157 | 12 | 35 | 26.1% |
| Wyoming | 45 | 169 | 13 | 33 | 28.9% |
| North Dakota | 43 | 143 | 10 | 36 | 23.3% |
| Alaska | 26 | 100 | 10 | 19 | 38.5% |
| Washington DC | 10 | 61 | 4 | 6 | 40.0% |
| Puerto Rico | 1 | 1 | 0 | 1 | 0.0% |
Each state links to what charging actually costs there, worked from that state’s own residential electricity rate.
How to check this for yourself
The station locator is public and the filters that produced these numbers are the ones in its own interface: fuel type electric, charging level DC fast, status available, United States, public access only. Everything above is that query, counted. If your own count differs, the usual reason is the private and fleet-only sites — there are 225 of them in the same extract, and leaving them in raises the site total to 15,658. We exclude them because a charger you cannot drive up to is not a charger. The connector labels and codes are the locator’s own, documented in its API reference.
Take any single figure as a snapshot with a date on it. Our previous pull, on 7 September 2026, returned 15,939 public sites and 77,268 plugs; this one, nine days later, returns 15,433 and 76,041. Operators report additions and retirements at their own pace and the maintainers prune what no longer verifies, so the total moves in both directions.
What this means when you are choosing a car
Less than the plug argument suggests. The power a site delivers and the number of stalls it has decide your wait, not the shape of the connector, and the tables above show those two things pulling in opposite directions: the larger sites are disproportionately NACS, the wider coverage is CCS1. What a car does once it is plugged in is a property of the car, ranked in fastest-charging electric cars, and what the electricity costs when you charge at home instead is in the running-cost calculator.
We have deliberately not published a per-car connector table on this page. Our own database holds the US connector separately from the European one and it is not yet filled in for every car, and a table with gaps in it would be read as a table of facts. Check the port on the car in front of you rather than a table on any website, this one included.
Frequently asked questions
What connector do most US fast-charging sites use?
CCS1. 12,401 of 15,433 public DC fast-charging sites list it, 80.4 per cent, in the AFDC locator as of 16 September 2026.
How many NACS fast-charging sites are there in the US?
4,873 sites list the NACS (J3400) connector, 31.6 per cent of public DC fast-charging sites. 1,763 of those belong to networks other than Tesla. Note that the locator files NACS under the code TESLA; its J3271 code is the MCS truck standard and appears at 2 sites.
Is CHAdeMO dead?
Not in the ground. 5,533 US fast-charging sites still list a CHAdeMO plug, more than list NACS. New installations have moved on; the installed base is large and is not being pulled out.
Why do the connector numbers add up to more than the number of sites?
Because a site is listed once per connector it carries. The rows are not exclusive and cannot be turned into percentages of a whole.
Sources
US Department of Energy — Alternative Fuels Data Center station locator, public DC fast-charging stations in the United States with status “available”, retrieved 16 September 2026; connector labels and codes are the locator’s own, per its API field documentation. Private and fleet-only sites are excluded. Our standing assumptions are on the methodology page.