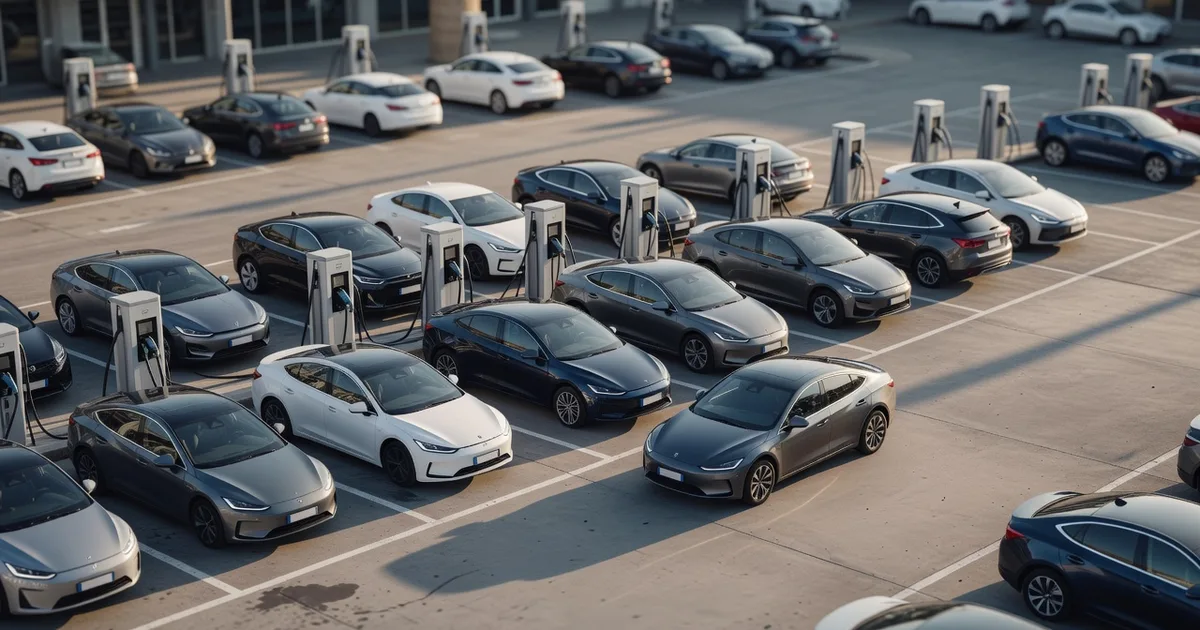
There are 74 registered electric cars for every public fast-charging plug in the United States. The states with the most plugs are not the best served — they are the worst. California has 19,089 plugs, more than any other state by a wide margin, and still 97 cars competing for each one. Wyoming has 169, and 11.
Building the most chargers is not the same as having enough
Charger counts get published as league tables, and on those tables California wins everything. Divide by the cars that need them and the ranking inverts almost exactly: California has 113.0 times as many plugs as Wyoming and 8.6 times as many cars per plug. The states that adopted electric cars first built the most infrastructure and still ended up the most stretched, because demand arrived faster than concrete.
The five most crowded are District of Columbia (211), Hawaii (176), Washington (103), New Jersey (98), California (97). The five least are Wyoming (11), North Dakota (13), South Dakota (19), Mississippi (21), West Virginia (22). Two of the crowded five — District of Columbia and Hawaii — are special cases: a city and an island, both with short average journeys and little room for large charging sites.
Every state, ranked by how many cars share a plug
Registrations are through 2025, published by the Department of Energy from Experian data and rounded to the nearest hundred vehicles. Plug counts were read on 2026-09-07. The two are not the same vintage, so treat the ratio as a fair comparison between states rather than a precise figure for any one of them. The plug total here is 77,265 rather than the 77,268 we count nationally, because Puerto Rico has 3 plugs and no registration figure in this dataset, so it is left out of both sides of the ratio.
| State | Rank | Electric cars | Fast plugs | Cars per plug | vs national |
|---|---|---|---|---|---|
| District of Columbia | 1 | 12,900 | 61 | 211 | +138 |
| Hawaii | 2 | 35,100 | 199 | 176 | +103 |
| Washington | 3 | 236,400 | 2,296 | 103 | +29 |
| New Jersey | 4 | 210,000 | 2,133 | 98 | +25 |
| California | 5 | 1,843,100 | 19,089 | 97 | +23 |
| Colorado | 6 | 162,800 | 1,695 | 96 | +22 |
| Arizona | 7 | 141,800 | 1,526 | 93 | +19 |
| Florida | 8 | 450,400 | 5,139 | 88 | +14 |
| Maryland | 9 | 120,500 | 1,543 | 78 | +4 |
| Virginia | 10 | 134,900 | 1,808 | 75 | +1 |
| Nevada | 11 | 85,600 | 1,180 | 73 | −1 |
| Texas | 12 | 387,400 | 5,421 | 71 | −2 |
| Oregon | 13 | 98,000 | 1,376 | 71 | −2 |
| Georgia | 14 | 161,200 | 2,303 | 70 | −4 |
| Utah | 15 | 68,400 | 1,022 | 67 | −7 |
| Rhode Island | 16 | 9,800 | 152 | 64 | −9 |
| Connecticut | 17 | 48,800 | 767 | 64 | −10 |
| North Carolina | 18 | 121,000 | 1,920 | 63 | −11 |
| Michigan | 19 | 112,600 | 1,804 | 62 | −11 |
| Minnesota | 20 | 59,800 | 963 | 62 | −12 |
| Ohio | 21 | 94,200 | 1,547 | 61 | −13 |
| New York | 22 | 209,300 | 3,461 | 60 | −13 |
| Massachusetts | 23 | 113,900 | 1,999 | 57 | −17 |
| Pennsylvania | 24 | 113,400 | 2,030 | 56 | −18 |
| Illinois | 25 | 164,900 | 2,972 | 55 | −18 |
| Tennessee | 26 | 55,400 | 1,024 | 54 | −20 |
| Louisiana | 27 | 22,600 | 418 | 54 | −20 |
| Delaware | 28 | 16,000 | 311 | 51 | −22 |
| Kansas | 29 | 18,700 | 382 | 49 | −25 |
| Missouri | 30 | 43,700 | 919 | 48 | −26 |
| Wisconsin | 31 | 41,900 | 899 | 47 | −27 |
| New Hampshire | 32 | 16,100 | 350 | 46 | −28 |
| Indiana | 33 | 47,200 | 1,029 | 46 | −28 |
| Kentucky | 34 | 20,700 | 458 | 45 | −28 |
| Idaho | 35 | 14,100 | 314 | 45 | −29 |
| Nebraska | 36 | 11,800 | 278 | 42 | −31 |
| Arkansas | 37 | 12,300 | 300 | 41 | −33 |
| Alaska | 38 | 4,100 | 101 | 41 | −33 |
| South Carolina | 39 | 35,700 | 947 | 38 | −36 |
| Vermont | 40 | 11,900 | 326 | 37 | −37 |
| Oklahoma | 41 | 26,800 | 929 | 29 | −45 |
| Maine | 42 | 11,900 | 429 | 28 | −46 |
| New Mexico | 43 | 16,600 | 616 | 27 | −47 |
| Alabama | 44 | 24,400 | 910 | 27 | −47 |
| Montana | 45 | 6,900 | 262 | 26 | −47 |
| Iowa | 46 | 15,100 | 608 | 25 | −49 |
| West Virginia | 47 | 5,000 | 223 | 22 | −51 |
| Mississippi | 48 | 7,200 | 351 | 21 | −53 |
| South Dakota | 49 | 3,000 | 160 | 19 | −55 |
| North Dakota | 50 | 1,900 | 146 | 13 | −61 |
| Wyoming | 51 | 1,900 | 169 | 11 | −62 |
| United States | — | 5,689,100 | 77,265 | 74 | — |
Only 10 of the 51 states sit above that national figure, and the median state is at 54 rather than 74. That gap is the whole point: the national number is not a description of the country, it is a description of California, which holds 32 per cent of America’s electric cars and drags the average with it. A typical state is far better provisioned than the headline suggests, and a typical electric car is in a state that is not.
What your state would need
Set a target and the arithmetic follows: cars divided by target, minus the plugs already there.
Your state, and what it would take to fix it
The national figure is 74 cars per plug. This is a density measure, not a queue: most charging happens at home, and only a fraction of these cars use a public fast charger in any given week.
What this ratio does and does not mean
It is a density measure, not a queue length. The overwhelming majority of charging happens at home overnight, which is why a driver in a well-provisioned rural state and a driver in a crowded coastal one can have the same experience: neither uses a public fast charger most weeks. What the ratio predicts is what happens on the days when they do — a holiday weekend, a long drive, a cold snap that shortens everyone’s range at once.
It also says nothing about where inside a state the plugs are. A state can look comfortable in aggregate while its chargers sit in two metropolitan areas and its highways have none, which is the pattern in most of the low-ratio states in this table. And it counts plugs, not working plugs: operators report their own status, and the count here is the optimistic case.
The related question — how many of those plugs are at sites with only one stall — is in how many fast chargers the US actually has, and what a stop costs in time is in how many charging stops a 500-mile drive takes.
Frequently asked questions
How many EVs are there per charger in the US?
74 registered electric cars for every public DC fast-charging plug, from 5,689,100 cars and 77,265 plugs. Counting all public charge points including slower Level 2 gives a much lower number, but those are for parking rather than travelling.
Which state has the worst charger coverage per car?
District of Columbia, at 211 cars per plug, followed by Hawaii at 176. Both are unusual: one is a city, the other an island, and neither has much room for large charging sites.
Which state has the best?
Wyoming, at 11 cars per plug — 8.6 times better provisioned than California despite having 113.0 times fewer plugs. Low adoption, not heavy investment, is the reason.
Does a high ratio mean I will queue?
Not on an ordinary week, because most charging is done at home. It matters on the days everyone drives at once, and it matters more if your car is slow to charge — every extra minute you occupy a stall is a minute someone else waits. The charging speeds are in the fastest-charging electric cars.
Is this getting better or worse?
This page is a single snapshot and cannot answer that. The two inputs move in opposite directions — new plugs are commissioned continuously, and so are new cars — and the honest position is that one measurement does not make a trend. We will publish the comparison when we have a second reading taken the same way.
Sources
Registered electric cars: US Department of Energy — Alternative Fuels Data Center, vehicle registration counts by state, figures through 2025, derived by the National Laboratory of the Rockies from Experian Information Solutions data and rounded to the nearest 100 vehicles; fuel type is identified from the vehicle identification number, and the electric column excludes plug-in hybrids. Charging plugs: US Department of Energy — Alternative Fuels Data Center, alternative fuel station locator, read 2026-09-07, filtered to public DC fast charging in the United States. The ratio, the ranking and the shortfall arithmetic are ours.