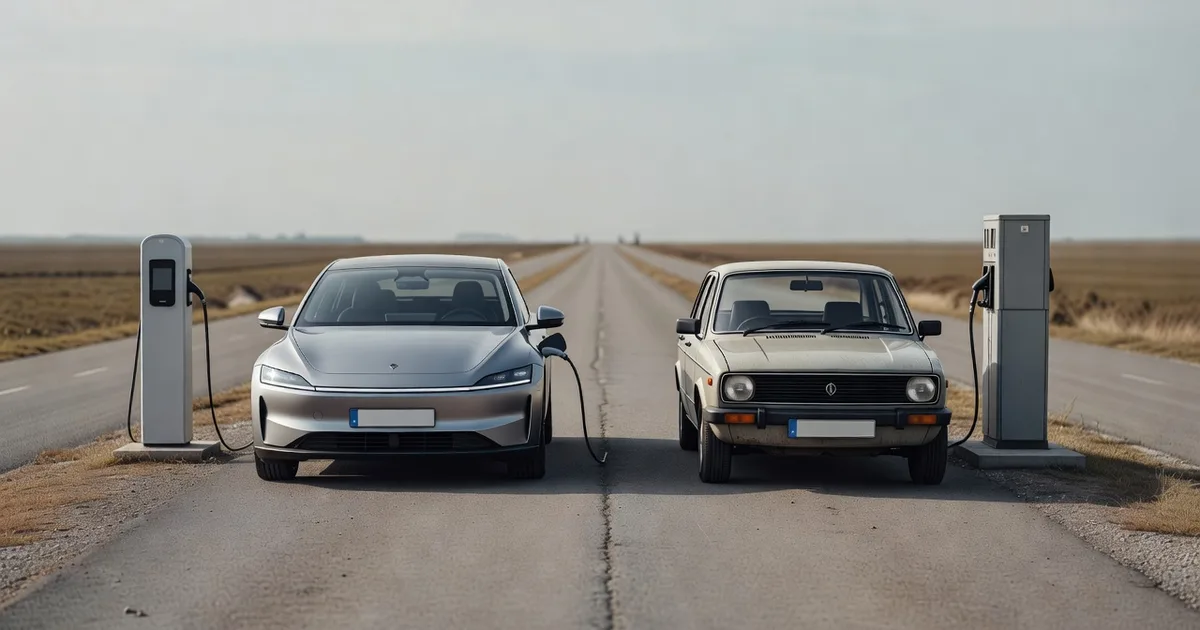
For Europe: on identical mileage, an EV run mostly on home charging costs about €509–€668 a year in electricity against €1,850 for petrol — a €1,340 saving. Even 100% public rapid charging still saves €707. In the US the gap is closer to a third than a half; home charging, not the badge, decides the outcome.
The energy cost, worked through
Take the Hyundai Ioniq 6 at its real-world consumption of 149 Wh/km, against a petrol saloon at 6.8 L/100 km, over 13,000 km a year in Europe.
| Scenario | Energy cost per year | Versus petrol |
|---|---|---|
| Petrol, €2.09/L | €1,850 | — |
| EV, 100% home charging at €0.2629/kWh | €509 | €1,340 saved |
| EV, 75% home / 25% public (our default) | €668 | €1,182 saved |
| EV, 100% public rapid at €0.59/kWh | €1,143 | €707 saved |
The gap between the best and worst row is more than double, on the same car, driven the same distance. That is the whole argument of this article: the variable that decides your outcome is not the badge, it is the plug.
Now run the same exercise on the Kia EV9 at 221 Wh/km. On 100% public charging its energy cost is around €1,695 a year — only €155 less than the petrol saloon. An inefficient electric SUV charged exclusively in public barely saves money, and no amount of enthusiasm changes the arithmetic.
Run these numbers with your own tariff and mileage — every assumption in the calculator is visible and editable.
What it costs in Europe, and how that compares with the US
Both markets favour the electric car on running cost, and by a similar margin — but they get there for opposite reasons. America has cheap electricity and, by its own standards, expensive petrol. Europe has expensive electricity and much more expensive petrol, because most of the pump price is tax. The two effects very nearly cancel, which is why the headline ratio is close to three to one on both sides of the Atlantic.
In the US, home electricity runs about $0.184/kWh and petrol $4.071 a gallon. A Model Y Long Range at 27.5 kWh/100 miles costs $5.06 per 100 miles to charge at home, against $15.08 for a 27 mpg petrol car over the same distance. That is a ratio of almost exactly three to one.
In Europe, the same car uses 16.5 kWh/100 km. At the EU average rate for a car-charging household, €0.2629/kWh, that is €4.34 per 100 km, against €14.23 for a 6.8 L/100 km petrol car at the EU weighted-average pump price of €2.092 a litre (Weekly Oil Bulletin, 21 September 2026). The ratio is 3.3 to one — marginally wider than the American figure, not narrower.
One detail is worth pulling out, because most comparisons get it wrong. The €0.2629 above is Eurostat’s band for households using 5,000–15,000 kWh a year, not the €0.2896 headline rate for the 2,500–5,000 kWh band that most articles quote. Charging a car at home moves a typical household into that higher-consumption band, where the unit rate is lower. Buying the car changes the price of the electricity you were already using.
What the continental average hides is the country. Across the EU the same car and the same petrol comparator produce anything from 2.2 to 5.1 times:
| Country | Electricity | Petrol | EV per 100 km | Petrol per 100 km | Ratio | Saved per 13,000 km |
|---|---|---|---|---|---|---|
| Hungary | €0.1325 | €1.752 | €2.19 | €11.91 | 5.4× | €1,264 |
| Finland | €0.1807 | €2.364 | €2.98 | €16.07 | 5.4× | €1,702 |
| Bulgaria | €0.1354 | €1.663 | €2.23 | €11.31 | 5.1× | €1,180 |
| Lithuania | €0.1613 | €1.950 | €2.66 | €13.26 | 5.0× | €1,378 |
| Slovakia | €0.1680 | €1.853 | €2.77 | €12.60 | 4.5× | €1,278 |
| Croatia | €0.1645 | €1.796 | €2.71 | €12.21 | 4.5× | €1,235 |
| Denmark | €0.2437 | €2.618 | €4.02 | €17.80 | 4.4× | €1,791 |
| France | €0.2285 | €2.219 | €3.77 | €15.09 | 4.0× | €1,472 |
| Malta | €0.1416 | €1.340 | €2.34 | €9.11 | 3.9× | €881 |
| Latvia | €0.2135 | €1.997 | €3.52 | €13.58 | 3.9× | €1,308 |
| Estonia | €0.2051 | €1.917 | €3.38 | €13.04 | 3.9× | €1,255 |
| Greece | €0.2381 | €2.197 | €3.93 | €14.94 | 3.8× | €1,431 |
| Netherlands | €0.2669 | €2.449 | €4.40 | €16.65 | 3.8× | €1,592 |
| Portugal | €0.2302 | €2.107 | €3.80 | €14.33 | 3.8× | €1,369 |
| Slovenia | €0.1959 | €1.706 | €3.23 | €11.60 | 3.6× | €1,088 |
| Spain | €0.2360 | €1.928 | €3.89 | €13.11 | 3.4× | €1,198 |
| EU average | €0.2629 | €2.092 | €4.34 | €14.23 | 3.3× | €1,286 |
| Luxembourg | €0.2332 | €1.849 | €3.85 | €12.57 | 3.3× | €1,134 |
| Italy | €0.2919 | €2.141 | €4.82 | €14.56 | 3.0× | €1,267 |
| Sweden | €0.2173 | €1.579 | €3.59 | €10.74 | 3.0× | €930 |
| Poland | €0.2520 | €1.820 | €4.16 | €12.37 | 3.0× | €1,068 |
| Czechia | €0.2622 | €1.884 | €4.33 | €12.81 | 3.0× | €1,103 |
| Romania | €0.2690 | €1.891 | €4.44 | €12.86 | 2.9× | €1,095 |
| Germany | €0.3476 | €2.348 | €5.74 | €15.97 | 2.8× | €1,330 |
| Austria | €0.3038 | €1.925 | €5.01 | €13.09 | 2.6× | €1,050 |
| Cyprus | €0.2678 | €1.677 | €4.42 | €11.40 | 2.6× | €908 |
| Belgium | €0.3274 | €1.988 | €5.40 | €13.52 | 2.5× | €1,055 |
| Ireland | €0.3438 | €1.945 | €5.67 | €13.22 | 2.3× | €982 |
Ireland and Hungary are the two ends of the EU, and the gap between them is larger than the gap between Europe and America. They also arrive at their positions differently. Hungary leads because it has the cheapest household electricity in the EU. Finland almost matches it on electricity that costs a third more, because Finnish petrol is the fourth-dearest in the union — the ratio is a race between two prices, and either one can win it.
National variation swamps the average in both places. Petrol ranges from €1.34 a litre in Malta to €2.52 in Denmark inside the EU alone — a spread of more than a euro a litre, within one customs union. The catch on the European side is that public rapid charging is expensive too, so the penalty for having no driveway is harsher here than in the US. The two sides of this comparison also come from different dates: the pump prices are the Commission’s bulletin for 21 September 2026, while Eurostat publishes household electricity only twice a year and the latest settled period is the second half of 2025. Any article quoting a single European figure, including this one, is quoting a number that is wrong for most individual readers. Change it in the calculator.
EV vs gasoline running costs in Europe: what the 2026 ICCT study found
The most-cited European figure of 2026 is the International Council on Clean Transportation’s EV Transition Check, published on 7 September 2026. Across the EU in 2025, it puts a battery-electric car at 33 per cent cheaper to operate than its petrol counterpart. Drivers who charged only on public chargers, the worst case for an electric car, were still 28 per cent cheaper than petrol.
The gap widened at the start of 2026: the ICCT reports that energy costs for combustion cars rose by 12 to 36 per cent depending on the country, while the cost of charging an electric car was largely unchanged. Two further numbers from the same report bear on the purchase side of this page. In Germany, inflation-adjusted electric-car prices fell 18 per cent between 2020 and 2025 while petrol-car prices rose 2 per cent, and battery costs fell 35 per cent over the same five years.
Why is the ICCT’s 33 per cent so much narrower than the three-to-one energy ratio above? Because the two measure different things. The ratio in our table is energy only, for one efficient car against one 6.8 L/100 km petrol car at average prices. The ICCT figure is a fleet-wide running-cost comparison, and energy is the single line where the electric car’s advantage is widest. Put the two together and the reading is consistent: on fuel alone an electric car in Europe costs roughly a third of what petrol does, and once everything else is counted it still comes out about a third cheaper to run. The country-by-country version of this arithmetic, with every EU electricity and petrol price, is on our EV charging cost in Europe page.
Purchase price and the break-even point
Running costs are only half the question. If the electric car costs €8,000 more to buy and saves €1,000 a year, break-even is roughly eight years — about as long as most people keep a car.
Three things move that calculation:
- Mileage. The saving is per kilometre, so break-even moves in direct proportion. At 25,000 km a year the same gap closes in under five years; at 6,000 km it never closes.
- Incentives. Where a grant or tax credit applies it comes straight off the gap. Where it does not — and most schemes have income, price or leasing conditions — enter zero.
- The comparison car. The purchase premium has narrowed sharply. The Volvo EX30 at €44,990 is priced against ordinary petrol crossovers, not above them.
Depreciation: the cost nobody budgets for
On a three-to-five year ownership, depreciation typically dwarfs fuel in either direction. A car that loses €20,000 of value over five years has cost €4,000 a year before a single kilowatt-hour — four times the fuel saving in our worked example.
Electric residuals have been volatile, hit by rapid model turnover, falling new prices and buyer uncertainty about battery health. That uncertainty is itself softening as fleet data accumulates: a 0.3% battery replacement rate among recent model years is the kind of fact that eventually shows up in used prices.
We label residual estimates as estimates and leave them blank where we have no defensible figure, because a confidently wrong residual can swing a total-cost comparison by more than everything else combined.
What our calculator deliberately leaves out
Insurance, servicing, tyres, road tax and finance interest are excluded, and it is worth being explicit about which way each cuts:
- Servicing favours the electric car. No oil, no filters, no exhaust, far less brake wear thanks to regeneration.
- Tyres favour the petrol car. Electric cars are heavier and deliver torque instantly; tyres wear faster.
- Insurance is mixed and varies enormously by market, model and repair-network maturity.
- Tax is entirely local and changes almost every year.
Including national averages for these would make the output look more precise than it is. A number you can verify beats a number that merely looks complete.
Carbon: honest arithmetic
Our calculator counts generation and tailpipe emissions only. On EU grid intensity of about 230 g CO₂/kWh, the Ioniq 6 example above emits roughly 445 kg a year, against about 2,043 kg for the petrol saloon at 2.31 kg per litre. On the UK grid at 131 g/kWh the electric figure falls to about 254 kg; on the US grid at 350 g/kWh it rises.
What that excludes is manufacturing, where an electric car starts at a deficit because of the battery. It catches up over the first years of driving — sooner on a clean grid, later on a coal-heavy one. ZeroCarbonDrive works through that manufacturing phase, battery included, in its lifecycle guide to an electric car’s carbon footprint, with the payback period for different grids. Anyone calling an electric car zero-emission from day one is not counting properly. Anyone claiming the manufacturing debt is never repaid is not counting either.
Common mistakes
- Comparing an electric SUV to a small petrol hatchback. Compare against the car you would otherwise actually buy.
- Using the official consumption figure as your own. Winter, motorway speeds and a roof box all push real consumption well above it — expect twenty to thirty percent worse in cold weather.
- Assuming public charging is a rounding error. At three times the home rate it dominates the result for anyone without a driveway.
- Counting an incentive without checking eligibility. Most have conditions. Enter zero unless you have confirmed it.
- Ignoring efficiency because the battery is big. A big inefficient pack costs more to buy, insure, replace and fill. Efficiency is the row that keeps paying.
Practical guidance
- Settle the home charging question first. If the answer is no, and there is no cheap charging at work, the financial case is weak — be honest with yourself before you shop.
- Check whether an overnight tariff is available. Time-of-use rates can halve the electricity cost again and are the single best upgrade to the numbers here.
- Shop efficiency, not battery size. Two cars with the same range and very different consumption will not cost the same to run.
- Use your own numbers. The calculator takes your tariff, your mileage and your petrol car, and nothing you type leaves your browser.
The electricity line of this calculation, worked out for every EPA-rated car at average US mileage, is in what it costs to charge an electric car per month and, state by state, in charging cost across all fifty states; the home-charger decision that sits behind it is in 7.7 kW against 11.5 kW at home.
Frequently asked questions
Is an EV cheaper than petrol in 2026?
On energy, yes for almost everyone who charges at home — roughly a third of the cost in the US and about half in Europe. On total cost including purchase and depreciation, it depends on mileage, the purchase gap and any incentive. Break-even under five years is common at average mileage; it is not universal.
Are EVs cheaper to run than gasoline cars in Europe?
Yes. The ICCT’s EV Transition Check 2026 found electric cars 33 per cent cheaper to operate than petrol cars across the EU in 2025, and 28 per cent cheaper even for drivers who only used public charging. On energy alone the advantage is larger: at the EU average household rate a Model Y costs €4.34 per 100 km to charge at home against €13.26 of petrol for a 6.8 L/100 km car.
What if I can only use public charging?
The saving shrinks sharply and, with an inefficient car on an expensive network, can disappear entirely. This is the scenario where the honest answer is that an electric car may not save you money yet.
How many years to break even?
Divide the purchase price gap by the annual energy saving. At a €8,000 gap and €1,000 saved a year, roughly eight years. At the same gap and 25,000 km a year, closer to four. The calculator does this with your own figures. Narrowing the gap at the outset is the other lever on the same sum, and the cheapest cars that still cover a real 400 km are ranked on cheapest long-range electric cars.
Should I worry about paying for a new battery?
Less than the headlines suggest. Replacement runs to roughly $130–$200 per kWh installed out of warranty, but the observed replacement rate among 2022-and-later cars is about 0.3%, warranties run eight to ten years with a 70% floor, and module-level repair is increasingly common. Our degradation analysis covers the data.
Does a bigger battery cost more to run?
Not per kilometre directly — consumption does that. But a bigger pack usually comes in a heavier, less efficient car, and it costs more to buy, insure and replace. Compare the consumption row, not the capacity row.
Battery replacement cost is the line item most people worry about, and the chemistry in the car changes it: LFP packs are the cheapest per kWh and the slowest to wear out, while NMC costs more per kWh but weighs less for the same range.
Sources
- US EIA — weekly retail gasoline price, $4.071/gal at 31 August 2026; residential electricity rates
- Eurostat nrg_pc_204 — household electricity, all taxes included, second half of 2025: €0.2896/kWh for the 2,500–5,000 kWh band and €0.2629/kWh for the 5,000–15,000 kWh band used above
- European Commission Weekly Oil Bulletin — Euro-95 with taxes, 21 September 2026: EU27 consumption-weighted average €2.092 a litre, national prices €1.340 (Malta) to €2.618 (Denmark)
- EPA eGRID and Ember yearly electricity data — grid carbon intensity; DEFRA/DESNZ 2026 factors for the UK
- Vehicle consumption figures from EV Database and the EPA, cited individually on each vehicle page
Every default used above is listed with its source on the methodology page. Nothing here is financial advice.